Composed dashboard
The agent assembles a layout of charts and panels answering the question just asked.
“Why did churn go up in Q3?”
Q3 churn
3.4%
SELECT churned / active FROM accounts WHERE quarter = '2026-Q3' Finished setup in month one
41%
78%
SELECT seat_band, AVG(setup_done_30d) FROM onboarding WHERE cohort IN ('Jul','Aug','Sep') GROUP BY seat_band Churn by account size, Q3
SELECT seat_band, churn_rate FROM accounts WHERE quarter = '2026-Q3' GROUP BY seat_band Monthly churn 2026 2025
SELECT month, churn_rate FROM accounts_monthly WHERE month BETWEEN '2025-04' AND '2026-09' In the wild
How 2 products ship this pattern. Click a screenshot to enlarge it.
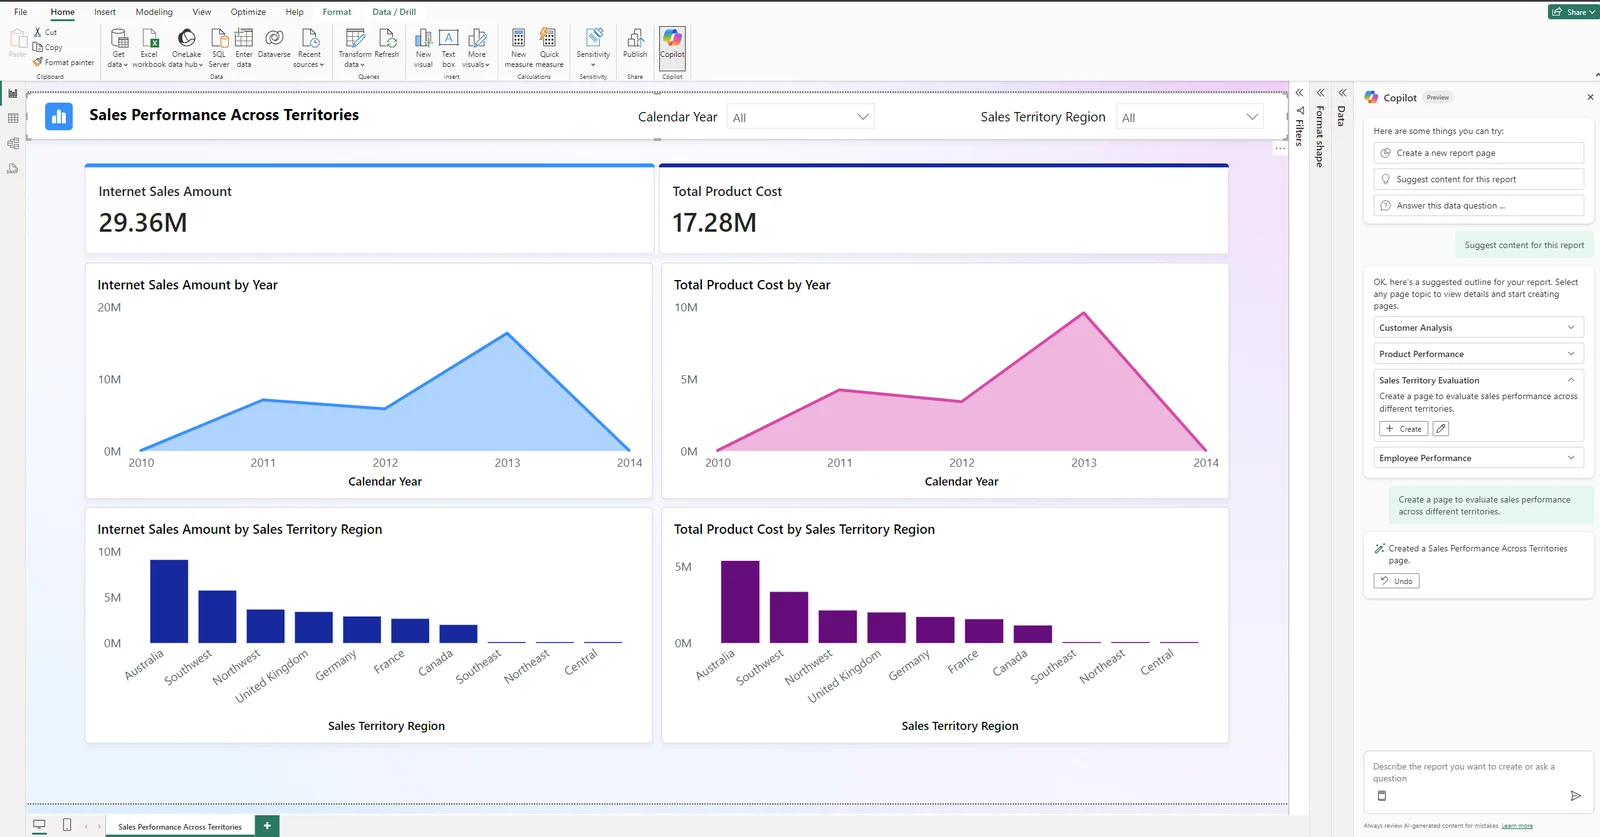
Power BI Copilot
Copilot proposes a report outline, then builds a full page of KPI cards and charts for the chosen topic, which can be edited or undone from the pane.
Source: Microsoft Learn ↗
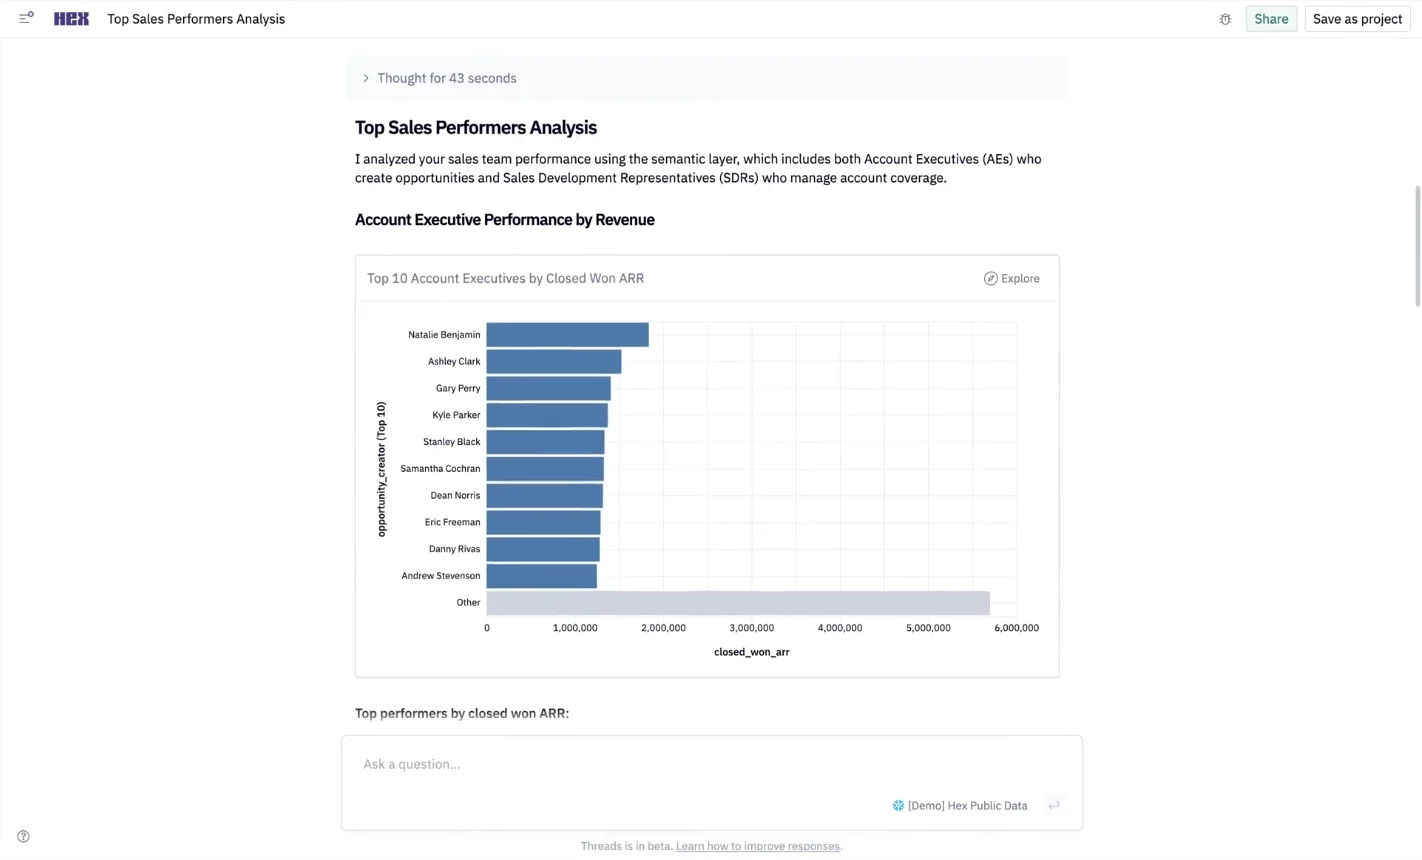
Hex Threads
Asked a plain-language question, the Threads agent writes a short analysis and assembles charts from the semantic model, which can be saved as a project.
Source: Hex blog (launch video) ↗
When to use
Analytics and monitoring where the useful view differs with every question.
Seen in
Julius and Hex AI analyses, Power BI copilot pages, Salesforce dynamic dashboards.
For engineers
Emit a layout spec you can persist and re-run; keep the underlying query visible and editable.
Build prompt
A neutral, component-only prompt for a coding agent. Edit the stack block or anything else to fit your project, then copy it.
Download this prompt as Markdown, or every prompt as JSON for an agent.
Critique checklist for generative ui
0 of 4 checked
These questions apply to every pattern in this family. Ticks are saved in this browser.